


Improving primary health care through evaluation

How we enabled NMML improve coordination, collaboration and responsiveness of care across five local government areas.
The situation
Northern Melbourne Medicare Local (NMML) needed a comprehensive stock take of the delivery of primary health services across their five Local Government Areas (LGAs) to inform strategic direction over the next three years. The information was required to identify gaps in programs and services, as well as opportunities to improve coordination, collaboration and the responsiveness of care.
In order to meet this need, Grosvenor was engaged to conduct extensive primary care service capacity mapping and a needs assessment for the five LGAs in NMML.
The challenge
There were three key challenges:
- primary health services are diverse with many categories of service being relevant to the review
- multiple data points were required for each primary health service
- no single source of information existed.
The project
Various methods and data sources were utilised to collect, collate and analyse the data required for this project. These included:
- desktop research to compile service mapping data of allied health service providers, supplemented with telephone contact or ‘mystery shopper calls’, as required
- desktop research to identify demographic information at the LGA and, where possible, suburb level to determine the population locations and characteristics
- distribution of an online survey to the Practice Managers of General Practices. If required, a fax friendly version was provided and hard copy responses accepted
- collation of information into data tables, using the prescribed template
- interviews and a survey with selected NMML stakeholders and partners
- collation of collected information into heat maps showing the locations of all service providers. Where possible maps were also produced to depict service providers with particular characteristics, for example, those which provide after hours services. An example heat map is included below.
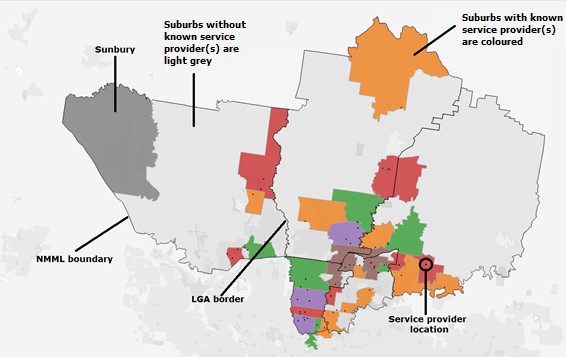
Example Heat Map
![]()
Number of service providers by suburb
In all heat maps, the location of each service provider (based on its GPS coordinates) was shown with a black dot. All suburbs with at least one service provider were shaded in accordance with the legend to show the total number of services available.
By reviewing the heat maps in conjunction with demographic data for each of the LGAs it was possible to clearly identify the locations where the number and type of services aligned with the demographic needs, and the locations with potential service gaps.
A comprehensive report and deliverable set was provided detailing the results in a number of formats to optimize usability for NMML. Each deliverable/format caters to a different need or purpose, including:
- collated data, analysis and findings to support conclusions and recommendations
- raw data to enable NMML to complete additional future analysis of service coverage if required
- data collection tools and reference tables to demonstrate how data had been collected and allow NMML to collect additional data to support any future service capacity mapping.
The results
The report and supplementary deliverable set were very well received by NMML. In particular the visualisation of services on heat maps was highly useful for effective planning and decision making.
The comprehensive deliverables also enable NMML to replicate much of the analysis in future years without additional assistance.